
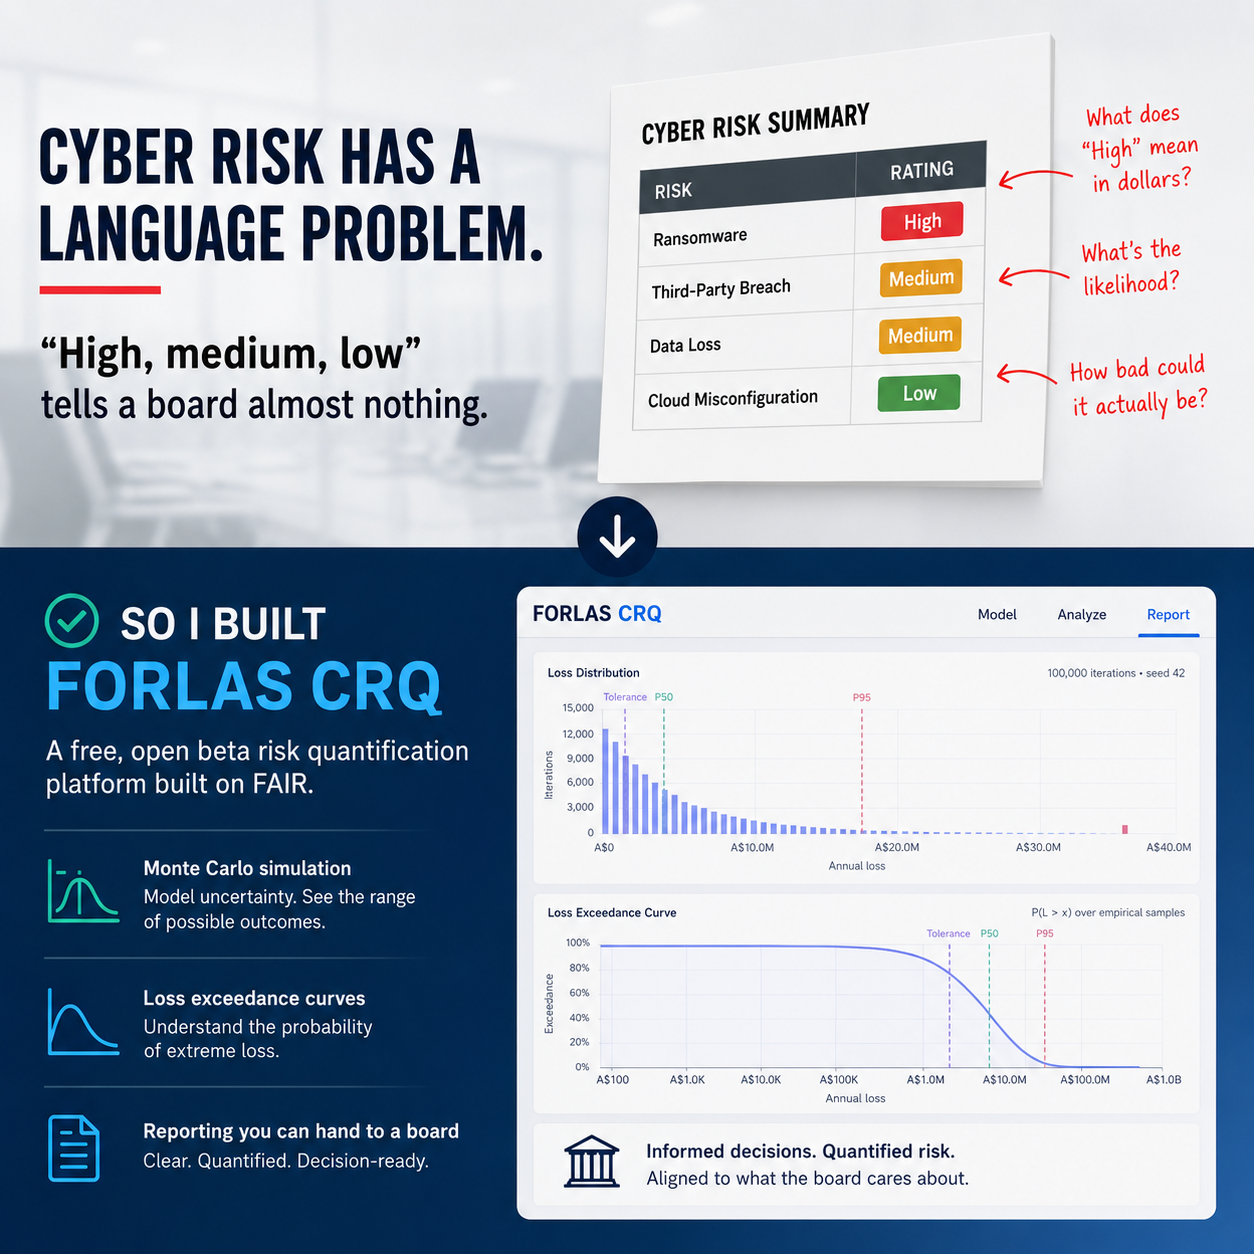
Ask a security team about their top risks and you will usually get colours. A heat map with some red boxes, a register full of high, medium, and low, maybe a 5x5 matrix with scores like 16 and 20 that look numeric but aren't.
Here is the problem: a board can't budget against colours. "High" doesn't tell anyone whether to spend fifty thousand dollars or five million. Two assessors can look at the same scenario and file it in different boxes, and nobody can say which of them is right, because the scale has no units.
What the colours are hiding
Risk matrices feel rigorous, but they compress wildly different situations into the same cell. A risk that will probably cost you $40,000 this year and a risk with a 2% chance of costing $30 million can both land in "medium". Decision science has been pointing at these failures for years: range compression, inconsistent interpretation between raters, and arithmetic performed on ordinal scales that was never mathematically valid in the first place.
The uncomfortable truth is that colour-coded risk ratings are a communication convention, not a measurement.
Measurement is possible
None of this is new territory. Insurers have priced cyber risk in dollars for years, and the FAIR methodology (Factor Analysis of Information Risk) gives security teams the same basic machinery: break a loss scenario into how often it happens and how much it costs when it does, estimate each as a range rather than a false-precision point, then let a Monte Carlo simulation combine them.
Run a scenario a hundred thousand times and you stop getting a colour and start getting a curve: "there is a 10% chance our annual losses from this scenario exceed $2.4 million." That is a sentence a CFO can act on. Aggregate every scenario and you get a loss exceedance curve for the whole portfolio, which is the closest thing cyber has to a P&L view of risk.
The gatekeeping problem
So why isn't everyone doing this? Mostly because the tooling has been gatekept. The established CRQ platforms are capable and enterprise-priced, typically five figures a year before services. Below that, teams cobble together spreadsheets that are fragile, opaque, and hard to audit. There has been no serious middle.
That gap is the reason FORLAS CRQ exists.
What FORLAS CRQ is
FORLAS CRQ is a quantitative cyber risk platform built on FAIR, now in open beta, and free:
- FAIR-based scenario modelling with Monte Carlo simulation
- Portfolio aggregation with loss exceedance curves
- PDF and Word reporting written for boards and auditors
And it is local-first, which I consider non-negotiable rather than a feature. Your risk register describes your crown jewels, your weaknesses, and your worst days. It is one of the most sensitive documents your organisation holds. FORLAS runs as one executable with one database file that you own. No cloud, no accounts, no telemetry. Pull the network cable and everything still works.
The other half: calibrated humans
A quantitative model is only as good as the estimates feeding it, and untrained estimators are reliably overconfident. Ask someone for a 90% confidence interval and the truth typically lands inside it far less often than nine times in ten.
The good news is that this is trainable. Calibration training, repeated estimating with immediate feedback, measurably fixes overconfidence. So alongside FORLAS there is Calibrated Course: free, offline, self-contained HTML tools with a practice trainer, Brier scoring, and a nine-module course. Run it before your experts feed numbers into any quantitative model, mine or anyone else's.
Try it, break it, tell me
FORLAS CRQ is in open beta. If you work in cyber risk, GRC, or security leadership, I would genuinely value your feedback: what works, what breaks, what is missing. Both tools are free and on GitHub, and the contact links are on the home page.
I build these because I believe practical, professional grade cybersecurity should not be exclusive. Cloud should be a choice. Knowledge should be within reach. Security is attainable.